Summary Report No 1 on Policy Relevant Findings
TRACK is a UKRI funded project between academic partners, PHE, DSTL and DfT which aims to evaluate the likely risk of COVID-19 transmission on public transport and evidence on transmission mitigation measures, particularly tube, rail and bus. The project focuses predominately on scenarios in London, Leeds and Newcastle although also includes data collection from a number of other regional transport operators.
The project focuses on five aspects: probabilistic modelling to evaluate potential risk of transmission during transport journeys; determining whether the virus is present in the environment; analysing passenger demographics and the journeys they make; using CCTV analysis to understand the interaction of passengers with the vehicles they are travelling on; assessment of airflows to understand exposure to aerosols.
Key findings to date
Risk modelling: An initial probabilistic risk model and visualisation tool have been developed that considers transmission of the SARS-COV-2 virus that causes COVID-19 through three routes: close range (aerosol and droplet at <2m); airborne (aerosol at >2m); hand-to-face following contact with contaminated surfaces. These have been applied to a London tube scenario (Victoria Line). Preliminary conclusions are relevant for this line and may hold for other similar underground lines. It is not likely that they can all be generalised to other transport scenarios. These conclusions are based on initial findings and may be subject to change as more information becomes available:
- Close-range exposure to an infected person is predicted to contribute most to total exposure risk to the SARS-COV-2 virus in most circumstances, followed by contact with contaminated surfaces. The high ventilation rate in this tube line, combined with the relatively short exposure duration (< 1 hour) means the long-range airborne route is likely to be the smallest contribution. However, this may not be the case for other transport modes or longer duration journeys. It is important to note that close-range includes inhalation of virus so is also a form of airborne transmission. It is not clear whether these different exposure routes are equivalent in terms of their ability to result in infection; this is outside of the TRACK project but it is hoped further understanding will become available over the next 6 months.
- Exposure to the SARS-COV-2 virus through contaminated surfaces seems to depend on “unlucky” events, where a small number of passengers touch particularly heavily contaminated surfaces during their trip. Cleaning strategies are not yet included in the model, but it is considered that daily cleaning might not be able to effectively remove this risk, and it is more likely to be mitigated by strategies to facilitate good hand hygiene for passengers soon after touching high-frequency touch points.
- The prevalence of infection among passengers seems to be the parameter that has the strongest effect on total exposure risk and the risk per passenger. Strategies to limit infectious people travelling could have a significant impact on overall infection risk for the passengers population.
- High levels of mask wearing compliance (75%) have a noticeable impact on the predicted total dose received, with further reduction particularly for those “unlucky” people who are exposed to the highest viral dose via close contact and/or surfaces with compliance over 90%.
- Mask wearing provides the greatest impact by reducing the amount of viral droplets released into the environment, which potentially mitigates all transmission routes including the surface contact routes through reduced deposition onto surfaces. They also provide some protection for the wearer..
- Strategies to facilitate social distancing may have a significant impact on exposure. This would directly depend on controlling loading levels accordingly, and it is beneficial to enhance social distancing approaches when there is higher prevalence of infection in the passenger community. The effects of reduced passenger loading and mask wearing are a similar order of magnitude in the model.
Environmental microbiology: Protocols have been established for taking regular environmental samples from surfaces in transport vehicles, and results from 1 train operator (Dec, Jan, Feb) and 1 bus operator (Jan, Feb) have been analysed to date. In each case 20 samples were taken from each vehicle at each sampling date.
- Overall, around 11% of samples were positive for viral RNA and 25% suspect positives1. It should be noted that the levels found do not indicate the presence of infectious virus; the data simply indicates that the virus was present at some stage, which suggests that people with the virus have travelled on the vehicle. RNA can persist for weeks in the environment on surfaces and it is unclear whether cleaning can effectively remove residual RNA.
- Early indications suggest detection of RNA traces may be associated with prevalence of infection in the community. Sites where viral RNA has been detected include surfaces around seating (handholds, arm rests, tables) and sites that are less frequently cleaned such as air extract ventilation grilles.
Passenger demographics and interactions: Early work has focused on analysis of existing data sets including the All-Change Travel Tracker Survey and the Leeds and Newcastle COVID-19 Lifestyle surveys as well as analysis of passenger numbers and loading from operator data.
- Early analysis of passenger data suggests that public transport use is very heterogeneous across the UK, and some routes have higher use than expected at >70% of pre-COVID-19 levels.
Ventilation of vehicles: Environmental measurements have been taken on a train carriage, typical of those on long distance rail journeys, to measure air distribution and carbon dioxide as a proxy for ventilation rate.
- Initial analysis and evaluation of current EU design guidance suggests that ventilation rates in some inter-city train carriages may be much lower than the recommended rates in buildings. Lower ventilation rates are more likely to raise the potential for aerosol transmission and this could pose a higher risk on longer duration journeys. While risk has not yet been modelled for these scenarios, emerging evidence on risk factors from outbreaks in buildings suggests that ventilation may be an important factor for some journeys.
Next steps
Following advice from our policy steering board, the TRACK team are planning to focus the next phase of modelling work on transmission risks associated with bus travel. This is likely to be the largest mode of transport outside London, and the mode where reducing risks has the greatest impact on communities who are at most risk of infection and more severe health outcomes. Initial outcomes from this work are expected in summer 2021. A third scenario is likely to focus on commuter rail, which is planned for autumn 2021.
We will continue to take monthly microbial samples from transport vehicles and as this data set grows over the next 3 months we expect to be able to identify trends in where evidence of virus is found and how this is affected by prevalence, location and mitigations such as cleaning. We are undertaking laboratory and real-world assessments of the effectiveness of anti-viral surface coatings and expect initial data in summer 2021.
We are starting primary data collection of passenger demographics and journey information and are currently processing CCTV and ticketing data to inform passenger loading and interactions. Work on ventilation is continuing, including discussion with industry representatives on ventilation system design and potential mitigations across different vehicle types.
Contact: Prof Cath Noakes, University of Leeds, [email protected]
Summary Report No 2 on Policy Relevant Findings
TRACK is a UKRI-funded project between academic partners, PHE, DSTL and DfT which aims to evaluate the likely risk of COVID-19 transmission on public transport and provide evidence on transmission mitigation measures, particularly for tube, rail and bus. The project encompasses five aspects: probabilistic modelling to evaluate potential risk of transmission during transport journeys; determining whether the virus is present on surfaces (fomites) in transport vehicles and the effectiveness of mitigations specific to the fomite route; analysing passenger demographics and the journeys they make; using CCTV analysis to understand the interaction of passengers with the vehicles they are travelling on; and assessment of airflows to understand exposure to aerosols.
This report details the key policy relevant findings from work so far. The majority of insights are drawn from two models, a quantitative microbial risk assessment (QMRA) model that simulates transmission by three routes (close range, touching surfaces (known as fomites) and airborne) in a subway carriage and more recently in a single decker bus, and a simplified airborne risk model that has been predominantly applied to mainline trains and only considers airborne exposure.
It must be noted that results are derived from models and are supported by ventilation analysis, transport use data and environmental sampling, but do not measure infection directly. All models carry assumptions and uncertainties and therefore this is based on the best knowledge of transmission mechanisms at the time of writing. The appendix includes brief summaries of the models including details of some of the key assumptions.
Executive summary
- Transmission of the SARS-CoV-2 virus is possible in public transport settings and all three modes of transmission (close-range, airborne, via surfaces) are likely to be important. Mitigations should therefore consider all routes (high confidence);
- Exposure to the virus is likely to be low in many transport settings due to relatively short exposure times and passenger respiratory activity that is generally passive (i.e. quiet breathing rather than loud talking or physical activity) (medium confidence);
- For a short journey, airborne exposure for an individual is likely to be low but relatively uniform among all passengers, while much higher but infrequent exposures could occur through close-range (aerosols and droplets) interaction and through fomites. These higher risk, lower probability events are likely to be important at the population scale due to the cumulative effect across multiple journeys (medium confidence);
- Airborne exposure is likely to be a greater concern on longer distance journeys due to the duration, or when there is loud behaviour that leads to higher aerosol emissions (medium confidence);
- Transmission risk on public transport is likely to increase with higher numbers of people travelling (passenger density) and the prevalence of virus among the travelling population (high confidence);
- The relative risk of transmission on public transport is complex to determine as it is influenced by multiple factors, but for the same duration of exposure it is likely to be comparable to many workplace settings (low confidence);
- Face coverings are likely to be an effective mitigation strategy as they reduce viral emissions and exposure by all routes of transmission (high confidence). Ventilation and hand hygiene are also likely to be important mitigation measures (high confidence). Deep cleaning is likely to be of lower importance (medium confidence);
- TRACK results inform appropriate mitigation of transmission risk on public transport, and the effectiveness of these mitigations will depend on national policy, transport operator policy and public behaviour, which in turn is likely to be more effective when supported by effective messaging and, where appropriate, enforcement (high confidence).
Modes of transmission
As in all environments where people interact, transmission may be possible by three routes: close range exposure to aerosols and droplets; airborne exposure to small aerosols at distances over ~2m; contact with contaminated surfaces. The relative importance of these transmission routes is likely to depend on the transport mode, passenger behaviours and journey type and duration. The majority of the models consider exposure rather than infection risk, and it is not yet clear how the dose received by different transmission routes translates into actual infection risk. This is the case for all routes but is particularly the case for the fomite route where modelling suggests potential for high exposure but epidemiological evidence for fomite transmission is scarce.
Close range exposure: Simulations of short duration journeys (subway and preliminary bus QMRA model results) suggest that the highest exposure is likely to happen when people are in close proximity to someone infected. For an individual passenger this is influenced by infrequent events with few individuals, but at a population scale becomes more important as it is multiplied up over many journeys. This increases with time spent on board, passenger density and prevalence of the virus among the travelling passengers.
Airborne transmission: QMRA models suggest that on journeys which are relatively short (typically under 30 min) and with passive passenger respiratory activity (but with some coughing) the airborne exposure is likely to be low but fairly uniform among all passengers in a particular vehicle/carriage. There may be a small number of occasions where an infected person with a sufficiently high viral emission rate could shed enough virus to enable long range airborne transmission on these short journeys. Airborne exposure increases with time spent on board, and therefore long-distance journeys are likely to carry a higher risk of airborne transmission due to the length of time of exposure.
Fomite transmission: Models suggest that exposure to virus via fomites and subsequent face touching may be possible and is dominated by a small number of infrequent events. The median dose is very low or zero in many simulations suggesting fomite exposure is uncommon for an individual, but as there are multiple contact surfaces within many public transport settings there is a small probability that some fomite doses could be high, which leads to a high mean exposure dose. Like close range transmission this exposure could become an important transmission route at population scale when multiplied over many journeys. Models of transmission on a bus suggests that the highest risk of fomite exposure may occur when someone sits in the same seat as a previously infected person and makes contact with the contaminated surfaces resulting from contaminated hand contact and deposition of droplets from the infected person’s breath. Simulations also show the potential importance of “traverse surfaces” such as poles as people move through the bus, where contamination could arise from the hands of infected people. This concurs with the TRACK results of environmental sampling on buses and mainline trains which have detected low levels of SARS-CoV-2 viral RNA (not infectious virus) on 13% of surfaces sampled, with the most frequent contamination on arm rests (21%) and tables/tray tables (17%), and lower contamination found in push open buttons (11%).
Figure 1 shows the predicted balance of exposure by these three routes modelled for one particular scenario in a subway carriage when the infectious person has a viral load of 3.6 x 10⁶ virus/ml. The predicted median (black horizontal line) and mean dose (triangle) for airborne exposure are similar indicating the relatively uniform exposure for all passengers. Close range doses are the highest and are dominated by low frequency encounters with infectious people. The median fomite dose is zero, but there are a small number of outliers with a high dose that influence the mean. Initial results from the bus modelling have been carried out to explore the effect of the viral load of infectious people. These suggest that the relative importance of airborne transmission may increase if infectious people have a higher viral load or if the dose needed to cause infection is reduced. It is possible that this may mean that airborne transmission is more likely with a more infectious variant such as the delta variant.
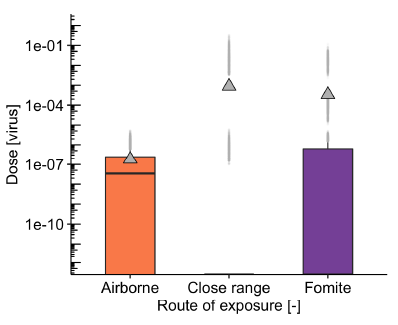
Figure 1: Modelled exposure by three routes for a subway carriage with infectious passengers having a viral load of 3.6 x 10⁶ virus/ml, 1% infectious passenger prevalence, 50% pre-pandemic loading of the carriage, 75% mask wearing and 127 air changes per hour (ACH) ventilation rate. The median exposure dose is shown by the black horizonal line and the triangle shows the mean dose, which is influenced by the smaller number of higher exposure cases. The box shows the interquartile range, the black whisker the 1.5 x interquartile range, and the grey points are outliers
Factors that influence exposure
Ventilation is a key mitigation for reducing the risk of airborne transmission over 2m, but it doesn’t have a significant impact on other routes of transmission. It is important on all journeys but is likely to have a more significant effect on longer journeys where people could be exposed to small aerosols for a longer period of time. Ventilation is predicted to reduce the viral dose associated with airborne transmission and affects most passengers in the carriage (median risk). However, ventilation has little effect on the much higher doses which expose a smaller proportion of passengers and are dominated by close range and fomite exposure routes. The QMRA subway model suggests that although airborne risks are likely to be low, increasing ventilation from 1 to 10 litres per second per person (l/s/person, equivalent to 13 to 127 air changes per hour (ACH) with high passenger loading in the subway model), can reduce the median airborne exposure to all passengers by 80%. The model also indicates that the relationship between ventilation rate and exposure is not simple as it is influenced by transient factors such as passengers getting on/off particularly on short journeys. This means that the virus concentration in air doesn’t always build up to the maximum that would be expected on a longer journey, especially when ventilation rates are low.
Data from TRACK and other projects suggest that ventilation rates vary between different transport modes and depend on the design, size and use of the vehicle/carriage. Ventilation flow rates in the subway model are based on the London Underground Victoria line and may be over 120 ACH (112 m3/min), however this is influenced by the small space and high passenger numbers; the rate equates to around 10 l/s/person at theoretical crush loading and is comparable to recommended rates in buildings. It is not known how this compares to other subway routes so simulations are carried out for a range of rates (1-112 m3/min). Bus ventilation rates are modelled as varying from 1.5 to 24 ACH (1.3- 21 m3/min), based on measurements, and reflects the range of ventilation rates seen with windows closed/open and vehicles moving/stationary. There are multiple metrics that can be used to describe ventilation rate, including a per person value (l/s/person), relative rate (ACH) and the absolute ventilation rate (m3/min etc); for a given viral emission rate and mask wearing, the airborne exposure experienced by a person during a journey depends mainly on the absolute flow rate (m3/min) rather than the relative value expressed as ACH.
Analysis of ventilation flows on a mainline train (802 carriage) suggests fresh air flow rates around 10-12 m3/min, which equate to around 7-8 ACH or 1.9-2.3 l/s/p at full seating capacity of 88; other trains have not been measured and may be different. A proportion of the ventilation air is recirculated, and initial analysis of experimental measurements suggests that the current HVAC filters do not have much effect on removing particles from the air. Experimental measurements investigating the impact of ventilation air distribution on the 802 train indicate some variation along the length of the carriage. Lower transmission risks are predicted if the infected person is sat at the end of a carriage rather than the centre, however in practice it is not possible to determine where an infected person is sat. The analysis also demonstrates local air distribution effects lead to higher airborne risks closer to the infected person, with a reduction of around 22% at 2 rows from the infector. However, although there are variations in risk with spatial position, it is the overall ventilation rate that has the most significant effect on airborne infection risk for a given viral emission rate and mask wearing. Measurements taken during TRACK have given insight into variability of ventilation rates on different transport modes, but there is limited data to understand this variation across the whole network.
Infectious virus prevalence in the travelling passenger community is a very significant factor that influences risk of exposure to the virus on public transport. Model results suggest that the mean exposure dose increases proportionally to the prevalence, with 10 times increase in prevalence resulting in around 10 times increase in mean exposure (see Figure 2 left; this is expected as it is determined by the average number of infectious passengers per journey. It is critical to note that the prevalence of infectious virus in the passenger community is not the same as the prevalence of virus across the whole of a community as measured by positive tests. The models simulate the effects of infectious passengers; some people are likely to be positive for COVID-19 but are not infectious. The proportion of passengers who are infectious is unlikely to include those who are highly symptomatic and will exclude many who are isolating with a positive test. However, because those using public transport are likely to be regularly leaving home, the prevalence may be higher than in some groups such as those working from home, and there may also be asymptomatic people who have not been detected through testing. TRACK sampling of environmental surfaces within trains and buses indicate that a higher proportion of samples show a presence of viral RNA during periods of high national prevalence; detection of SARS-CoV-2 RNA in public transport vehicles was the highest during the second wave (Dec 2020-Feb 2021) and then dropped during March-June 2021 when cases nationally were at a lower level, with July and August 2021 showing an increase in detection again.
Passenger density reflects the number of people travelling and influences the physical distancing between people on a journey. Analysis of TRACK travel data shows substantial variability between different modes of transport and different routes within a particular city during the pandemic, and hence it is challenging to assume a particular usage for any mode of transport. QMRA models have considered the effect of passenger densities on a subway between 10% and 100% of pre-pandemic levels (not overcrowding). The likelihood of exposure increases at a higher rate than the increase in loading (see Figure 2 right due to the higher probability of an infectious person being present and the closer proximity of passengers. Preliminary analysis of transport service loading shows that people are more likely to travel alone during peak hours and with others (family, friends) during off-peak periods. Consequently, there is more chance of being in close proximity to ‘strangers’ in the peak times. Whilst city centre zones have passengers on board for shorter times, high passenger turnover may, arguably, increase the chance of coming into contact with someone who has the virus – although contact time may be lower.
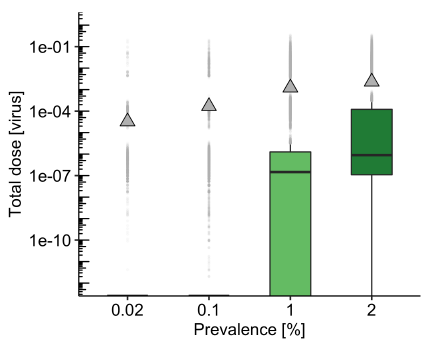
Figure 2: Modelled effect of virus prevalence in the passenger community (left) and passenger density (right) for the subway model with the same default parameters as figure 1. The mean dose increases linearly with prevalence and loading, but high prevalence and high loading together (not shown) disproportionately increase the median exposure.
Face covering wearing is a mitigation measure that potentially reduces exposure through all transmission routes. There is a double benefit from face covering wearing, with a reduction in exposure due to both the reduction in emission of virus by an infected person (source control) and the reduction in exposure for susceptible passengers. The effectiveness of face coverings depends on both the quality of the material and their fit, as well as the number of people wearing them. The QMRA subway model assumes that face coverings or masks eliminate emission of, and exposure to, large droplets but let 50% of small aerosols through; this is likely to be realistic for correctly worn 3-layer cloth face coverings or surgical style masks. The model suggests that these types of face covering could reduce the median exposure dose by around 2 times if 50% are wearing them and 3.7 times if 80% are wearing (see Figure 3); this largely reflects the reduction in airborne exposure. However, the impact on the low frequency but higher mean exposure dose is larger at 3 times when 50% are wearing and over 11 times if 80% are wearing, reflecting the reduction in high doses due to source reduction when people are at close range and reduced contamination of surfaces through droplet deposition and hand touch. Where a high proportion of people wear face coverings, the contamination of surfaces and hands may both reduce. Face coverings are therefore likely to be one of the most effective measures providing that sufficient numbers of people wear them correctly throughout their journey.
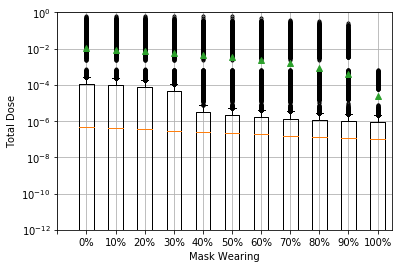
Figure 3: Modelled effect offace covering wearing for the subway model for the same default parameters as figure 1. Face coverings are assumed to work the same for emission and protection, blocking 100% of large droplets (over 20 micron) and 50% of aerosols. The median dose is reduced through reduction in airborne exposure, while the mean dose reduction is slightly greater and reflects the reduction in close range and fomite exposure including some of the outliers.
Hand hygiene is a factor that is challenging to model as it is very heavily determined by passenger behaviour. Use of hand sanitiser has been modelled within the most recent bus QMRA simulations; in the subway model it is just assumed that people cleaned their hands at a fixed time after alighting. Simulation results suggest that when 60% of passengers clean their hands (on boarding, alighting or both) there is a 48% reduction in the mean fomite dose but no change in the median dose. This reflects that any fomite exposure is likely dominated by low probability of high dose events. It also suggests that fomite exposure is likely to be mitigated to a low level by passenger behaviour; cleaning of hands and avoiding face touching can reduce the chance of exposure by this route. Early TRACK survey results indicate that attitudes to hand hygiene may vary substantially by gender, with males far less likely to be concerned about hand hygiene after travelling on public transport.
Cleaning of carriages/vehicles is a factor that is determined by transport operator policy. Cleaning has not been modelled explicitly, however some insights can be derived from the QMRA models. The models assume a clean carriage at the beginning of each full journey but indicate that exposure to the virus via fomites can potentially happen within the duration of the journey, which is a maximum of around 1 hour from initial to terminating station, with most passengers travelling for less than this period. This means that exposure can happen in a period of time that is less than the realistic frequency of cleaning and is therefore likely to be more effectively mitigated by approaches to enable regular hand hygiene than through enhanced cleaning. Some transport operators are applying antimicrobial coatings which claim to provide residual antiviral activity for up to 30 days after application. Preliminary TRACK results of a laboratory evaluation of a representative product have shown that antiviral efficacy of the coating is dependent on the surface material and the cleanliness of the surface after application.
Passenger respiratory activity is a factor that is determined by passenger behaviour but may be influenced by transport operator policy. Behaviour effects can be inferred from both airborne risk models and QMRA models; these and other published analysis indicate that the largest factor influencing risk of transmission is the viral emission rate from infected people. Published studies have shown that this can vary substantially between people. A large proportion of this variation cannot be identified or controlled as it stems from the viral load of infectious individuals and the natural variations in how much aerosol people exhale. Studies have shown that viral load changes over the course of an infection and peaks around the time of symptom onset. However studies considering both measurements of aerosol emissions [1,2] and virus emissions [3] suggest that people who are talking loudly or singing can emit 10-30 times more virus, predominantly in fine aerosols, than those who are passive. Loud talking, singing and aerobic exercise have been associated with airborne superspreading outbreaks in poorly ventilated buildings [4]. TRACK airborne risk models suggest that, over a 1-hour train journey, loud passengers emitting 10 times the virus as those who are passive could increase the relative risk of long-range airborne infection 10 fold. Analysis of viral emission assumptions in the QMRA models suggest that this increase in exposure could be even greater for close range exposure where the dose received could increase by up to 10,000 times when someone is speaking, or coughing compared to simply breathing (note that default simulations are for breathing with a cough every 3 minutes). It is also likely that passenger respiratory hygiene influences surface contamination too. Although this has not been modelled explicitly, the amount of virus on hands influences the amount of virus that can potentially contaminate surfaces and hence the potential for fomite transmission. While it is unfeasible and undesirable to prevent all speaking or coughing on public transport, measures to minimise significant loud activities or constrain these to particular carriages could be an appropriate measure to reduce risk and provide reassurance. Preliminary results from TRACK surveys have highlighted that people in younger age groups are less likely to either avoid touching surfaces or try to find a seat to socially distance on public transport than older people.
Vaccination has not been included as a factor in the modelling carried out so far in TRACK. Studies have shown that vaccination reduces transmission but that those who are vaccinated are still able to catch SARS-CoV-2 and in some cases can transmit the virus to others. People who are vaccinated and infected with the delta variant can sometimes have as high a viral load as those who are unvaccinated. The majority of the TRACK models consider exposure to virus rather than infection, as the dose required for infection is not known. Higher rates of vaccination are likely to result in a reduction in the prevalence of virus among those who are travelling and a reduction of infection risk if they are exposed, but it is reasonable to assume that if someone is infectious and vaccinated they could still expose others. Vaccination could also change the likelihood of having asymptomatic cases who are travelling. The consequences of exposure to the virus for a vaccinated person are likely to be far less severe than for an unvaccinated person.
Relative risk
The above analysis indicates that there are multiple parameters determined by national policy, transport operator policy and passenger behaviour that interact together to influence the risk of exposure to virus and hence the likelihood of transmission. Simulations carried out to date suggest that transmission risk on public transport for a single passenger journey is usually likely to be low, and much of the risk of exposure to the virus can be mitigated by effective transport operator policies and guidance to encourage, and where appropriate enforce, behaviours. Risks can also be reduced by individuals who are travelling paying attention to hand hygiene and wearing a good quality mask. It is not possible to identify an optimal set of mitigations, but it is important that there are strategies in place to manage all transmission routes.
It is hard to directly compare public transport settings with other environments as there are multiple interacting factors that influence both the likelihood of interaction with an infected person and the probability of transmission if the space is shared. Using a simple model for airborne transmission, it is possible to do some simple comparisons to estimate relative risk of infection through airborne exposure only in different transport scenarios and to compare to other environments. Initial analysis suggests that the airborne risk from an infected person on a 1 hour train journey could be an order of magnitude lower than being exposed to the same person in an office environment over 8 hours (see Table 1), which is predominantly due to the difference in exposure duration. This only considers airborne transmission, but the difference could be greater when also considering other modes of transmission, as in a workplace setting masks are less likely to be worn and people who are familiar with each other may be more comfortable to interact together in a more animated way. However, there may be a higher probability of encountering an infectious person on a train journey than in an office or other workplace, particularly when passenger density and prevalence of the virus is higher. This risk for an individual will also add up if journeys are made regularly, and hence the cumulative risk may be higher with respect to office settings where the same people are present. In other settings such as hospitality venues the risks would change again due to the type, number and frequency of interactions. The relative difference in risk will therefore depend both on the nature of the transport journey and the workplace or social environments that people interact within.
Table 1: Estimated infection risks for exposure to 1 infectious person on a train over 1 hour compared to 8 hours in an office. Calculations are carried out to represent a normal (1 quanta per hour) and highly infectious (100 quanta per hour) case respectively, but it should be noted that these values are chosen to illustrate the variation in risk rather than calculate a specific risk for a particular setting.
| 1 quanta h-1 | 100 quanta h-1 | ||
| Train (1 hour) | Estimate from in-service CO2 measurements | 0.043 % | 4.2 % |
| Estimate from modified Wells-Riley (1D model) | 0.058 % | 5.6 % | |
| Office (8 hours) | Well ventilated (10 l/s/p) | 0.27 % | 23.4 % |
| Poorly ventilated (5 l/s/p) | 0.53 % | 41.3 % |
Appendix – Model Summaries
Quantitative Microbial Risk Assessment (QMRA)
A probabilistic risk model has been developed that considers transmission of the SARS-CoV-2 virus that causes COVID-19 through three routes: close range (aerosol and droplet at <2m); airborne (aerosol at >2m); hand-to-face following contact with contaminated surfaces. The model is based on an approach used previously by other researchers to evaluate the potential infection routes on aircraft1. The model has been applied to a subway scenario (based on London tube) considering a range of parameters including the carriage loading to represent different levels of passenger density, prevalence of the virus in the population, cough hygiene behaviours, ventilation rate and face covering wearing. Passengers are assumed to touch surfaces as they board/alight and surface contamination accrues from infected passengers touching surfaces and through deposition of particles onto surfaces. An updated version of the model has recently been developed for bus travel, which includes the additional ability to fix passenger location and more detailed modelling of hand contamination and touching surfaces. Broad conclusions from the models of the subway and bus concur and are likely to hold for similar short duration journeys although the specific values and relative differences may not hold.
Wells-Riley airborne modelling
A second approach to modelling risk has been applied to consider airborne transmission on long distance train journeys. This approach is much simpler than the QMRA models and doesn’t require substantial depth code development or computing time, but it only considers the long range airborne transmission route. The approach uses a one-dimensional diffusion model for the virus particles in air to estimate the variation in concentrations of an airborne contaminant along the length of the carriage. A modified version of the Wells-Riley equation is then used to quantify the risk of infection to an occupant. The approach is able to relate infection risk to occupancy, degree of physical distancing, the location of infected occupants, ventilation rate, duration of exposure and viral emission rate; the later is characterised through a parameter known as ‘quanta’ which expresses the rate at which an infected person emits “infectious doses” of the virus.. A formulation of the Wells-Riley model that uses CO2 concentrations in air (the rebreathed fraction model) rather than ventilation rate and also considers the variation in quanta concentrations in air with time is also used to evaluate risks on carriages where CO2 measurements have been taken. The greatest unknown in the model is the quanta generation rate; this is a disease specific parameter and estimates for COVID-19 suggests it could vary from under 0.1 quanta/hr to over 1000 quanta/hr. Calculations are carried out for values of quanta of 1 h-1 and 100 h-1 to represent a normal and highly infectious case respectively. These values have been used by others as representative, but it should be noted that it is difficult to relate these values directly to a particular viral load in an infectious individual or a particular variant of the virus.
References
- Florence K. A. Gregson et al (2021) Comparing aerosol concentrations and particle size distributions generated by singing, speaking and breathing, Aerosol Science and Technology, 55:6, 681-691, DOI: 10.1080/02786826.2021.1883544
- G. Buonanno et al (2020) Estimation of airborne viral emission: Quanta emission rate of SARS-CoV-2 for infection risk assessment, Environment International, 141:105794
- Coleman KK, et al. Viral Load of SARS-CoV-2 in Respiratory Aerosols Emitted by COVID-19 Patients while Breathing, Talking, and Singing. Clin Infect Dis. 2021 Aug 6:ciab691. doi: 10.1093/cid/ciab691. Epub ahead of print. PMID: 34358292; PMCID: PMC8436389.
- EMG role of ventilation in controlling SARS-CoV-2 transmission, 30th Sept 2020 https://www.gov.uk/government/publications/emg-role-of-ventilation-in-controlling-sars-cov-2-transmission-30-september-2020
Contact: Prof Cath Noakes, University of Leeds, [email protected]